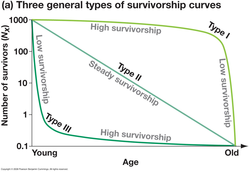
Curves which represents about surviving individuals in different age groups.
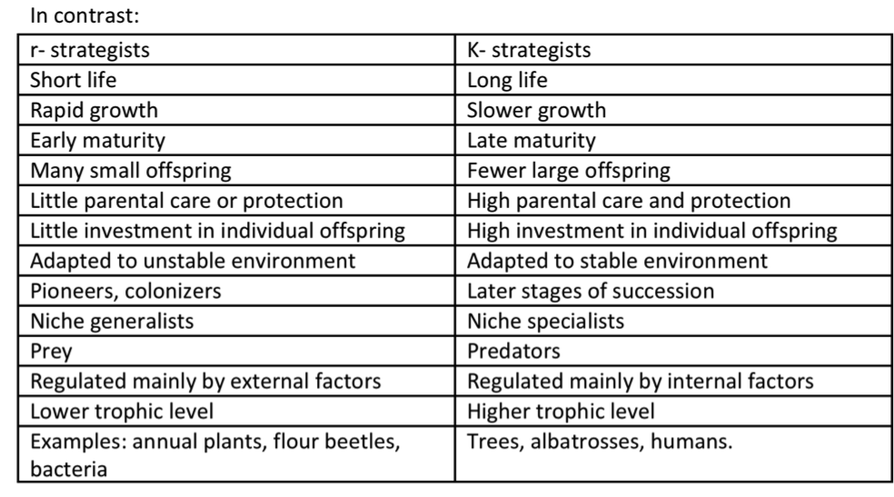
1.r -Strategies(For growth rate=r which is very high ) =Type III survivorship curve(population size varible, type of species found is pioneer,density independent )2.k-strategies(For carrying capacity=k )=Type I survivorship curve(Population size stable,climax species found ,density dependent)
Types-
1.Type-I Low death rate,High survival in early and middle life (HUMANS,SALMON)
2.Type-II Moderate death rate,survival is constant(CORALS,HYDRA,SONGBIRDS)
3.Type-III High death rate in early life,survival is low at early stage .(PLANTS,OYSTERS,TURTLES,COCKROACH,FROG,SEA URCHIN)
Image source credit-http://theamazonriver1.weebly.com/additional-information.html

Thank you for visiting my blog. Please do share your comments on
this article. Please subscribe and share the articles to get more such articles.


No comments:
Post a Comment